

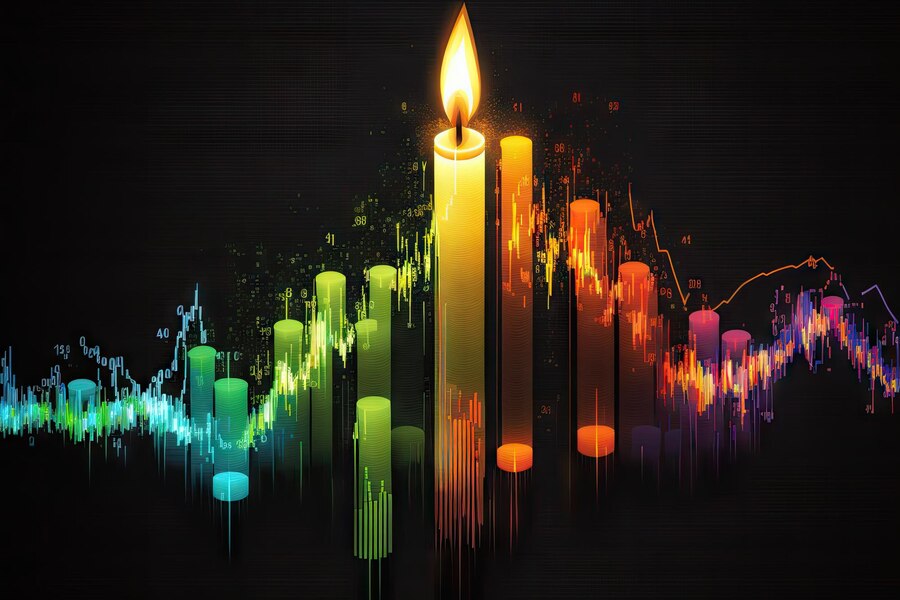
In the world of financial markets, understanding market sentiment is crucial for making informed trading decisions. Candlestick analysis, a powerful tool in the trader’s arsenal, provides a visual representation of price movements and market psychology. In this comprehensive guide, we will delve into the art of interpreting candlestick patterns and using them to predict market trends.
The Basics of Candlestick Patterns
Candlestick charts originated in Japan in the 18th century and have since become a staple in technical analysis. Each candlestick represents a specific time frame, usually a day, and consists of four main components: the open, close, high, and low prices. The body of the candlestick is colored differently based on whether the closing price is higher or lower than the opening price.
- Bullish Candlestick:
- The body is typically white or green.
- The opening price is lower than the closing price.
- Indicates buying pressure and optimism in the market.
- Bearish Candlestick:
- The body is usually black or red.
- The opening price is higher than the closing price.
- Suggests selling pressure and pessimism in the market.
Common Candlestick Patterns and Their Interpretations
1. Doji Pattern:
A doji occurs when the opening and closing prices are almost identical, creating a small or non-existent body. This pattern signals market indecision and a potential reversal.
2. Hammer and Hanging Man Patterns:
- Hammer: A bullish reversal pattern with a small body and a long lower shadow. It indicates potential buying interest after a downtrend.
- Hanging Man: Similar to the hammer but occurs after an uptrend. It signals potential weakness and a reversal in bullish momentum.
3. Engulfing Patterns:
- Bullish Engulfing: A bullish reversal pattern where a small bearish candle is followed by a larger bullish candle, completely engulfing the previous one.
- Bearish Engulfing: The opposite of the bullish engulfing pattern, signaling a potential reversal to the downside.
4. Morning and Evening Star Patterns:
- Morning Star: A bullish reversal pattern consisting of three candles – a bearish candle, a small doji or spinning top, and a bullish candle. It suggests a potential trend reversal from bearish to bullish.
- Evening Star: The bearish counterpart of the morning star, signaling a potential trend reversal from bullish to bearish.
Using Candlestick Patterns for Market Prediction
1. Identifying Trend Reversals:
- Candlestick patterns, especially reversal patterns like the engulfing patterns and doji, can be powerful indicators of a change in market direction. Traders use these signals to adjust their positions accordingly.
2. Confirmation with Other Indicators:
- To enhance the reliability of candlestick patterns, traders often use them in conjunction with other technical indicators like moving averages, RSI (Relative Strength Index), and MACD (Moving Average Convergence Divergence). This confirmation approach helps filter out false signals.
3. Support and Resistance Levels:
- Candlestick patterns around key support or resistance levels carry significant weight. A reversal pattern at a major support level may indicate a potential bounce, while the same pattern at a resistance level could suggest a reversal.
4. Time Frame Consideration:
- The effectiveness of candlestick patterns can vary with the time frame. Short-term traders may focus on intraday charts, while long-term investors may find weekly or monthly candlestick patterns more reliable for trend analysis.
Case Studies: Real-Life Application of Candlestick Analysis
1. Apple Inc. (AAPL):
- Analyzing Apple’s stock using candlestick patterns during key events such as earnings releases and product launches can provide insights into market sentiment and potential price movements.
2. Cryptocurrency Markets:
- Cryptocurrencies exhibit high volatility, making candlestick analysis especially valuable. Identifying patterns like the double top or head and shoulders can aid traders in making timely decisions.
Candlestick Analysis: A Cautionary Note
While candlestick analysis can be a powerful tool, it is not foolproof. Traders should be aware of the limitations and the potential for false signals. External factors such as economic events, geopolitical developments, or unexpected news can override technical signals.
Conclusion: Mastering the Language of Candlesticks
In the world of trading, mastering the art of candlestick analysis is akin to learning a new language. The ability to interpret the market’s mood through visual cues can significantly enhance a trader’s decision-making process. By understanding the various candlestick patterns and their implications, traders can gain valuable insights into market sentiment, identify potential trend reversals, and make more informed investment decisions.
Remember, like any skill, proficiency in candlestick analysis comes with practice. Traders should continuously refine their understanding of these patterns and integrate them into a broader trading strategy for optimal results. As the saying goes, “The candlestick doesn’t lie; it tells a story.” It’s up to traders to decipher that story and use it to their advantage in the dynamic world of financial markets.
FAQs on Candlestick Analysis: Decoding the Market’s Mood
Q1: What is candlestick analysis, and why is it important for traders?
A1: Candlestick analysis is a method of technical analysis used in trading to interpret and predict price movements in financial markets. It provides a visual representation of market sentiment through candlestick patterns, aiding traders in making informed decisions based on the prevailing mood of the market.
Q2: How do I read a candlestick chart?
A2: Each candlestick on a chart represents a specific time frame (e.g., a day) and comprises four main components – open, close, high, and low prices. The color and shape of the candlestick convey information about whether the market sentiment is bullish or bearish. A white or green candlestick signifies a bullish market, while a black or red one suggests bearish sentiment.
Q3: What are some common candlestick patterns and their meanings?
A3:
- Doji Pattern: Signals market indecision and a potential reversal.
- Hammer and Hanging Man Patterns: Indicate potential trend reversals, with the hammer being bullish and the hanging man bearish.
- Engulfing Patterns: Bullish engulfing signals a potential upward reversal, while bearish engulfing suggests a potential downward reversal.
- Morning and Evening Star Patterns: Morning star indicates a potential bullish reversal, while the evening star suggests a bearish reversal.
Q4: How can candlestick patterns be used for market prediction?
A4: Candlestick patterns are used to predict market trends and reversals. Traders look for patterns around key support and resistance levels, use them in conjunction with other technical indicators for confirmation, and analyze different time frames to assess the reliability of signals. These patterns can help identify potential entry or exit points in the market.
Q5: Are candlestick patterns foolproof indicators?
A5: No, candlestick patterns are not foolproof. While they provide valuable insights, external factors like economic events and unexpected news can influence the market independently of technical signals. Traders should exercise caution and use candlestick analysis as part of a broader strategy, incorporating risk management and other analysis tools.
Q6: Can candlestick analysis be applied to different markets, such as stocks and cryptocurrencies?
A6: Yes, candlestick analysis is versatile and applicable to various financial markets, including stocks, commodities, and cryptocurrencies. Traders commonly use candlestick patterns to analyze the price movements of different assets and make informed trading decisions.
Q7: How can beginners start learning candlestick analysis?
A7: Beginners can start learning candlestick analysis by studying the basic patterns and their meanings. Numerous online resources, books, and tutorials provide in-depth explanations and examples. It’s essential to practice analyzing charts and applying the knowledge gained through continuous learning.
Q8: Are there any limitations to candlestick analysis?
A8: Yes, there are limitations. Candlestick patterns are historical indicators based on past price movements and do not guarantee future outcomes. False signals can occur, especially in volatile markets. Traders should consider external factors and use candlestick analysis as part of a comprehensive trading strategy.
Q9: How often should traders check candlestick charts?
A9: The frequency of checking candlestick charts depends on the trader’s preferred time frame – whether they are day traders, swing traders, or long-term investors. Short-term traders may check intraday charts more frequently, while long-term investors might analyze weekly or monthly charts periodically.
Q10: Can candlestick analysis be automated with trading algorithms?
A10: Yes, candlestick analysis can be automated through trading algorithms. Many algorithmic trading systems incorporate candlestick patterns as part of their decision-making process. However, it’s crucial to regularly monitor and update these algorithms to adapt to changing market conditions.
Remember, while candlestick analysis is a powerful tool, successful trading requires a combination of technical analysis, risk management, and an understanding of broader market dynamics.