


In the vast and dynamic world of financial markets, traders are always on the lookout for patterns that can offer insights into future price movements. One such set of patterns that has gained popularity among traders is harmonic trading patterns. These patterns, based on the concept of Fibonacci retracement and extension levels, help traders identify potential reversal points and ride the hidden rhythms of the market.
Understanding Harmonic Patterns
Harmonic patterns are geometric price patterns derived from Fibonacci retracement and extension levels. The underlying philosophy is rooted in the idea that financial markets move in repetitive cycles and that these cycles can be identified through mathematical ratios. The primary ratios used in harmonic trading include 0.382, 0.500, 0.618, 1.272, 1.618, and others.
The ABCD Pattern
One of the foundational harmonic patterns is the ABCD pattern. This pattern consists of three legs, labeled as AB, BC, and CD. The length of each leg is determined by Fibonacci ratios. Traders use this pattern to identify potential reversal zones and make informed trading decisions.
The Gartley Pattern
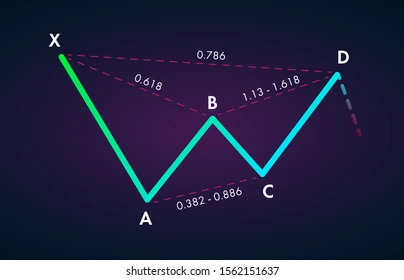
Named after H.M. Gartley, the Gartley pattern is another harmonic pattern that traders often look for in the markets. This pattern resembles the ABCD pattern but adds an extra level of complexity. It consists of five points labeled X, A, B, C, and D, forming specific Fibonacci relationships. The Gartley pattern helps traders anticipate trend reversals with a higher degree of accuracy.
The Butterfly Pattern
The Butterfly pattern is yet another harmonic pattern with distinct Fibonacci levels. Identified by the shape it creates on the price chart, the Butterfly pattern can signal potential reversal points in the market. Traders utilize this pattern to enter or exit positions strategically.
Identifying Harmonic Patterns
To successfully trade with harmonic patterns, it’s essential to identify them accurately. Traders often use charting software that automatically detects these patterns, but understanding the process manually enhances one’s trading skills.
Fibonacci Retracement and Extension Levels
Harmonic patterns rely heavily on Fibonacci retracement and extension levels. Traders must be proficient in drawing these levels on their charts to identify potential harmonic setups. Fibonacci retracement levels help mark potential reversal zones, while extension levels aid in projecting future price targets.
Pattern Ratios and Symmetry
Harmonic patterns are all about ratios and symmetry. Traders need to be meticulous in measuring and analyzing the relationships between different points of a pattern. A slight deviation from the prescribed ratios may weaken the reliability of the pattern.
Patience and Discipline
Successfully trading harmonic patterns requires patience and discipline. Traders must wait for the pattern to complete and confirm before making any trading decisions. Rushing into a trade without confirmation can lead to false signals and potential losses.
Trading Strategies with Harmonic Patterns
Once a trader has identified a harmonic pattern, the next step is to formulate a trading strategy. Here are some common strategies employed by traders when dealing with harmonic patterns.
Entry and Exit Points
Determining entry and exit points is crucial when trading harmonic patterns. Traders often enter a position at the completion of the pattern and place their stop-loss orders just beyond the pattern’s boundaries. Additionally, setting profit targets based on Fibonacci extension levels helps maximize potential gains.
Risk Management
Effective risk management is paramount in harmonic pattern trading. Traders should never risk more than a predetermined percentage of their trading capital on a single trade. This ensures that a series of losing trades does not deplete the trading account.
Confirmation with Other Indicators
While harmonic patterns are powerful tools, using them in conjunction with other technical indicators can enhance the probability of successful trades. Traders often look for confirmation from indicators such as RSI (Relative Strength Index), MACD (Moving Average Convergence Divergence), or trendlines to strengthen their trading decisions.
Common Challenges and Pitfalls
While harmonic patterns offer valuable insights, traders must be aware of the challenges and pitfalls associated with their usage.
Subjectivity in Pattern Identification
Identifying harmonic patterns is subjective, and different traders may interpret the same chart differently. This subjectivity introduces an element of uncertainty, making it crucial for traders to continually refine their pattern recognition skills.
Market Conditions
Harmonic patterns may not perform well in all market conditions. During strong trends or highly volatile periods, the reliability of harmonic patterns may diminish. Traders must be adaptable and recognize when market conditions are conducive to harmonic trading.
Overlooking Fundamental Analysis
Harmonic patterns primarily focus on technical analysis, but traders should not overlook the importance of fundamental analysis. Events such as economic releases, geopolitical developments, or corporate earnings can significantly impact the market, and traders need to consider these factors in conjunction with harmonic patterns.
Conclusion
In the ever-evolving landscape of financial markets, harmonic trading patterns provide traders with a unique perspective on market dynamics. By understanding the underlying principles, accurately identifying patterns, and implementing effective trading strategies, traders can harness the hidden rhythms of the market to make informed and potentially profitable decisions. As with any trading approach, continuous learning, adaptability, and disciplined execution are key to success in navigating the complexities of harmonic patterns.
Frequently Asked Questions (FAQs) about Harmonic Trading Patterns
1. What are harmonic trading patterns?
Harmonic trading patterns are geometric price formations derived from Fibonacci retracement and extension levels. These patterns help traders identify potential reversal points in the market by analyzing specific mathematical ratios within price movements.
2. How do harmonic patterns work?
Harmonic patterns work by identifying repetitive cycles and symmetrical structures in the financial markets. Traders use Fibonacci ratios to measure the relationships between different points in a price chart, allowing them to predict potential reversal zones and trend changes.
3. What are some common harmonic patterns?
Common harmonic patterns include the ABCD pattern, Gartley pattern, and Butterfly pattern. Each pattern is characterized by specific geometric shapes and Fibonacci relationships, providing traders with insights into potential market reversals.
4. How can I identify harmonic patterns on a price chart?
Traders can identify harmonic patterns by manually drawing Fibonacci retracement and extension levels on a price chart. Additionally, many charting software tools have features that automatically detect and highlight harmonic patterns.
5. Are harmonic patterns reliable for trading?
Harmonic patterns can be reliable indicators, but like any trading strategy, they are not foolproof. Traders should use harmonic patterns in conjunction with other technical indicators and consider market conditions to enhance their reliability.
6. What is the significance of Fibonacci retracement and extension levels in harmonic trading?
Fibonacci retracement and extension levels play a crucial role in harmonic trading by defining potential reversal zones and projecting future price targets. Traders use these levels to measure the relationships between different points in a harmonic pattern.
7. Can harmonic patterns be used in any market?
While harmonic patterns can be applied to various financial markets, their effectiveness may vary based on market conditions. Traders should be aware of the specific characteristics of the market they are trading and adapt their harmonic pattern strategies accordingly.
8. What is the recommended approach for entering and exiting trades based on harmonic patterns?
Traders often enter trades at the completion of a harmonic pattern and place stop-loss orders just beyond the pattern’s boundaries. Setting profit targets based on Fibonacci extension levels is also a common strategy to maximize potential gains.
9. How important is risk management in harmonic trading?
Effective risk management is crucial in harmonic trading. Traders should never risk more than a predetermined percentage of their trading capital on a single trade to protect themselves from significant losses.
10. Can harmonic patterns be combined with other trading strategies?
Yes, harmonic patterns can be combined with other trading strategies for increased confirmation. Many traders integrate harmonic pattern analysis with indicators like RSI, MACD, or trendlines to strengthen their trading decisions and enhance the probability of success.