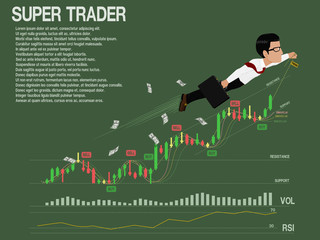
In the dynamic world of financial markets, traders constantly seek tools and strategies to gain an edge. Chart patterns, a visual representation of price movements, have emerged as a powerful means of predicting market trends. Mastering these patterns can be a game-changer for traders, providing valuable insights into potential price movements and aiding in informed decision-making.
Understanding Chart Patterns
Chart patterns are formations that appear on price charts, reflecting the historical behavior of an asset’s price. Traders use these patterns to identify potential trend reversals, continuations, and other market conditions. The key is to recognize recurring patterns and understand their implications for future price movements.
1. Head and Shoulders Pattern
One of the most well-known chart patterns is the Head and Shoulders. This pattern typically indicates a trend reversal from bullish to bearish. It consists of three peaks – a higher peak (head) between two lower peaks (shoulders). Traders interpret the completion of this pattern as a signal to sell, anticipating a downward trend.
2. Double Top and Double Bottom Patterns
The Double Top and Double Bottom patterns are reversal patterns that signal the end of an existing trend. The Double Top occurs after an uptrend and suggests a potential reversal to a downtrend, while the Double Bottom appears after a downtrend, indicating a potential reversal to an uptrend. Traders use these patterns to anticipate changes in market direction.
3. Triangles: Symmetrical, Ascending, and Descending
Triangle patterns are formations characterized by converging trendlines. The Symmetrical Triangle suggests a period of consolidation before a potential breakout, while the Ascending Triangle indicates a bullish continuation pattern. Conversely, the Descending Triangle points to a bearish continuation pattern. Recognizing these triangles helps traders anticipate the market’s next move.
The Predictive Value of Chart Patterns
Chart patterns have gained popularity because of their predictive value in forecasting future price movements. However, it’s essential to understand that no pattern guarantees absolute accuracy. Traders should use these patterns as part of a comprehensive analysis, considering other technical indicators, market conditions, and risk management strategies.
1. Confirmation through Volume Analysis
While chart patterns offer valuable insights, confirming their validity through volume analysis enhances their predictive value. An increase in trading volume during the pattern formation and confirmation stages adds credibility to the potential price movement. Traders should pay close attention to volume patterns to validate the signals provided by chart formations.
2. Timeframe Considerations
Chart patterns may vary in effectiveness depending on the timeframe in which they appear. Short-term traders may find success with patterns on lower timeframes, such as the 1-hour or 4-hour charts, while long-term investors might focus on daily or weekly charts. Understanding the appropriate timeframe for a specific chart pattern is crucial for accurate predictions.
3. Combining Chart Patterns with Technical Indicators
To enhance predictive accuracy, traders often combine chart patterns with technical indicators. Popular indicators such as Moving Averages, Relative Strength Index (RSI), and MACD (Moving Average Convergence Divergence) can provide additional confirmation or divergence signals, reinforcing the trader’s decision-making process.
Common Pitfalls and Challenges
While chart patterns offer valuable insights, traders should be aware of common pitfalls and challenges associated with relying solely on them for market prediction.
1. False Signals
One of the primary challenges is the occurrence of false signals. Not every chart pattern leads to a significant price movement, and traders must be cautious about overcommitting based on incomplete or unreliable patterns. Combining chart patterns with other forms of analysis helps mitigate the risk of false signals.
2. Subjectivity in Pattern Recognition
Pattern recognition is subjective, and different traders may interpret the same chart pattern differently. To minimize ambiguity, traders often use strict criteria and combine pattern analysis with other technical tools for a more robust approach to decision-making.
3. Market Conditions and News Events
External factors, such as unexpected news events or changes in market conditions, can influence price movements and disrupt the reliability of chart patterns. Traders should stay informed about economic indicators, geopolitical events, and other factors that may impact the market to avoid being blindsided by unforeseen developments.
Advanced Chart Patterns for Seasoned Traders
For seasoned traders looking to delve deeper into chart pattern analysis, several advanced patterns offer more nuanced insights into market dynamics.
1. Cup and Handle Pattern
The Cup and Handle is a continuation pattern that resembles the shape of a tea cup. It signifies a brief consolidation before a potential breakout to the upside. Traders often use this pattern to identify buying opportunities during an established uptrend.
2. Bullish and Bearish Flags
Flags are short-term continuation patterns that resemble rectangular-shaped flags on a pole. The Bullish Flag occurs after an upward price movement, indicating a brief consolidation before resuming the uptrend. Conversely, the Bearish Flag appears after a downward price movement, suggesting a temporary consolidation before a potential continuation of the downtrend.
3. Gartley and Butterfly Patterns
Gartley and Butterfly patterns belong to the family of harmonic patterns. These formations involve precise Fibonacci retracement and extension levels, providing advanced traders with more accurate entry and exit points. While these patterns require a deep understanding of Fibonacci ratios, they can offer a higher level of precision for those who master them.
Conclusion: Integrating Chart Patterns into Your Trading Strategy
Mastering chart patterns is an ongoing process that requires a combination of education, experience, and adaptability. Traders should continuously refine their skills and stay updated on market dynamics to effectively integrate chart pattern analysis into their trading strategies.
In conclusion, chart patterns offer traders a visual representation of historical price movements, serving as a valuable tool for predicting future trends. By understanding the various chart patterns, their predictive value, and the challenges associated with them, traders can enhance their decision-making process and gain a competitive edge in the dynamic world of financial markets. Remember, chart patterns are just one piece of the puzzle – a comprehensive approach, incorporating other technical indicators and risk management strategies, is key to successful trading.
Frequently Asked Questions (FAQs) about Chart Patterns in Trading
1. What are chart patterns, and how do they work in trading?
Chart patterns are visual formations on price charts that represent historical price movements. Traders use these patterns to analyze market trends, identify potential reversals or continuations, and make informed trading decisions. Chart patterns work by providing visual cues that suggest the likelihood of specific future price movements based on historical behavior.
2. Which are the most common and reliable chart patterns for traders?
Some of the most common and reliable chart patterns include the Head and Shoulders, Double Top and Double Bottom, and various triangle patterns (Symmetrical, Ascending, and Descending). These patterns are widely recognized and often used by traders for predicting trend reversals or continuations.
3. How can traders confirm the validity of chart patterns?
Traders can confirm the validity of chart patterns by incorporating volume analysis. An increase in trading volume during the pattern formation and confirmation stages adds credibility to the potential price movement. Additionally, combining chart patterns with technical indicators and considering the timeframe in which they appear enhances the confirmation process.
4. What challenges and pitfalls should traders be aware of when using chart patterns?
Traders should be cautious of false signals, which occur when a chart pattern does not lead to a significant price movement. Subjectivity in pattern recognition is another challenge, as different traders may interpret the same pattern differently. External factors such as market conditions and news events can also impact the reliability of chart patterns.
5. Can chart patterns be used alone for trading decisions?
While chart patterns provide valuable insights, relying solely on them for trading decisions may not be advisable. It is essential to consider other technical indicators, market conditions, and risk management strategies to create a comprehensive trading strategy. Chart patterns should be viewed as part of a broader analysis.
6. Do different timeframes affect the effectiveness of chart patterns?
Yes, the effectiveness of chart patterns can vary depending on the timeframe. Short-term traders may find success with patterns on lower timeframes, while long-term investors might focus on daily or weekly charts. Understanding the appropriate timeframe for a specific chart pattern is crucial for accurate predictions.
7. Are there advanced chart patterns for seasoned traders?
Yes, advanced chart patterns, such as the Cup and Handle, Bullish and Bearish Flags, and harmonic patterns like Gartley and Butterfly, provide more nuanced insights into market dynamics. These patterns require a deeper understanding of technical analysis and Fibonacci ratios, making them suitable for experienced traders.
8. How can traders integrate chart patterns into their overall trading strategy?
Traders can integrate chart patterns into their overall trading strategy by continuously refining their skills, staying updated on market dynamics, and combining pattern analysis with other technical indicators. A comprehensive approach that considers various factors, including risk management, enhances the effectiveness of chart pattern analysis.
9. Do chart patterns guarantee accurate predictions of future price movements?
No, chart patterns do not guarantee absolute accuracy in predicting future price movements. Traders should use chart patterns as part of a broader analysis and consider them alongside other factors. While patterns provide valuable insights, market conditions can change, and unexpected events can impact price movements.
10. How can traders stay informed about market developments that may affect chart patterns?
Traders can stay informed about market developments by regularly monitoring financial news, economic indicators, and geopolitical events. Being aware of potential external factors that may impact the market helps traders adapt their strategies and avoid being caught off guard by unforeseen developments.


